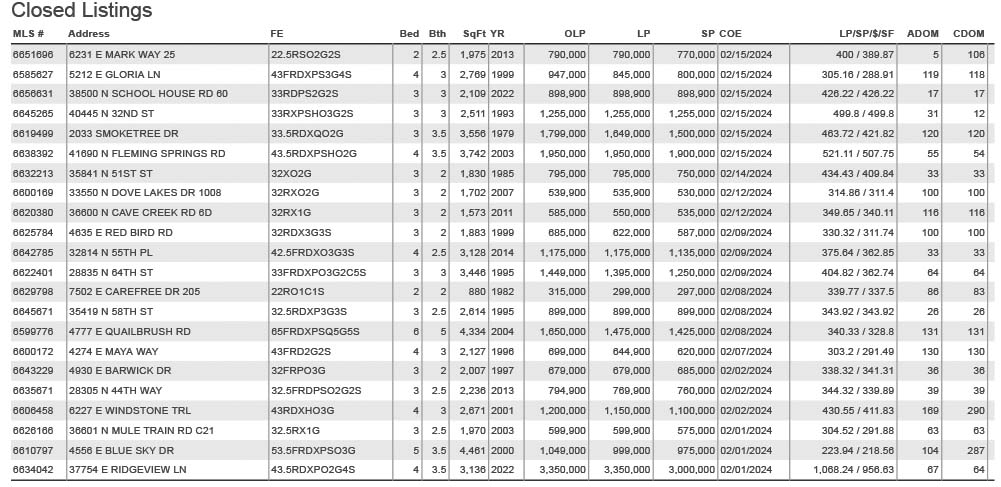
This issue I will fill this article with the February update from The Cromford Report. There is so much great data in here. The Cromford Report is a subscription platform only for Realtors. The people at the Cromford Report count the listings daily. Where many other articles are looking back in the rear view mirror by months, the Cromford Report gives me daily data. You have seen me use their data regularly. The MOHR Group uses this consistently to keep our finger on the market pulse.
Market Summary for the Beginning of February:
Here are the basics – the ARMLS numbers for February 1, 2024 compared with February 1, 2023 for all areas & types:
Active Listings (excluding UCB & CCBS): 15,574 versus 15,598 last year – down 0.2% – but up 7.1% from 14,543 last month
Active Listings (including UCB & CCBS): 18,421 versus 18,299 last year – up 0.7% – and up 11.9% compared with 16,457 last month
Pending Listings: 4,576 versus 5,109 last year – down 10.4% – but up 40% from 3,263 last month
Under Contract Listings (including Pending, CCBS & UCB): 7,423 versus 7,810 last year – down 5.0% – but up 45% from 5,127 last month
Monthly Sales: 4,397 versus 4,350 last year – up 1.1% – but down 10.8% from 4,928 last month
Monthly Average Sales Price per Sq. Ft.: $288.95 versus $267.73 last year – up 7.9% – and up 1.4% from $284.89 last month
Monthly Median Sales Price: $430,000 versus $410,000 last year – up 4.9% – but almost unchanged from $429,990 last month
This is a mixed picture. Closed listing counts remain desperately low at 4,397 per month, only up 1.1% from this time last year. However the number of listings under contract is growing nicely, up 45% from the dismal count at the start of the year. This is slightly better than the 43% we saw a year ago but not enough to signal a dramatic change in mood among buyers. We always expect to see strong growth between January and February and the observation in 2024 is middle-of-the-road.
A year ago the Cromford® Report was markedly more positive about the market than the general sentiment, with many people unwisely predicting a market crash. There is still no sign of a market crash in the short or medium term, but the big difference between this year and 2023 is the strengthening of the incoming supply. We have seen almost 20% more new listings year-to-date than we did in 2023. Many pundits tend to focus almost exclusively on demand and were dismayed by the weakness in demand 12 months ago. However supply is equally important and many of these same pundits failed to notice that unusually weak supply was the key issue in early 2023. That weakness has evaporated and although the active listing counts are still low by long-term standards, they are looking much healthier than last year. The number of active listings without a contract is up 7.1% over the last month. Last year they went down 4.3%. This is a significant difference.
It is always good for a seller to have less competition from other homes. In some price ranges, the competition has increased dramatically since the start of the year, but in others it has barely changed at all.
Single-family active listings priced at $2 million or above have increased by 28% over the last month, rising to 951. This is unusual.
Single-family active listings priced between $500,000 and $2 million have seen an increase of 8%, rising to 5,438. This is normal for the time of year.
Single-family active listings priced below $500,000 have seen a fall of 0.2% to 4,505. This means the low-end of the market is still experiencing tight supply.
Prices are up by almost 8% from this time last year when measured by average $/SF. They are up almost 5% if measured by median sales price. Home prices are up by more than the Consumer Price Index. Market crash forecasters got this completely wrong, and buyers who followed their advice to wait have made a costly mistake.
Volume remains weak but the overall market is still tilted slightly in favor of sellers, with the Cromford® Market Index stable around 117 to 118. This tilt towards sellers is weakening in the upper price ranges however. Buyers with more than $2 million to spend are probably thinking about flexing their negotiating muscles.


