


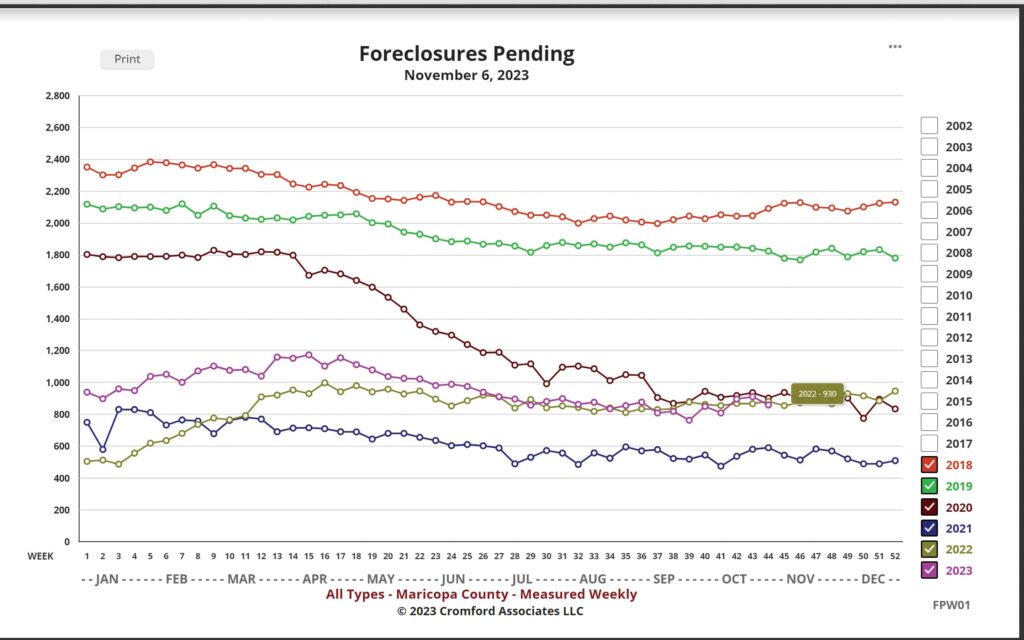
The Cromford Report has collected the data in the chart for pending foreclosures. You can certainly see the dramatic change in today’s current market. I thought back in 2008 and remembered that the short sales had to first be behind 3 months in payments (pending a foreclosure) in order to sell as a short sale. I decided to get a more clear picture of the actual distressed sales between 2008 and 2023. While 2023 isn’t exactly one full year, the differences in the numbers is staggering.
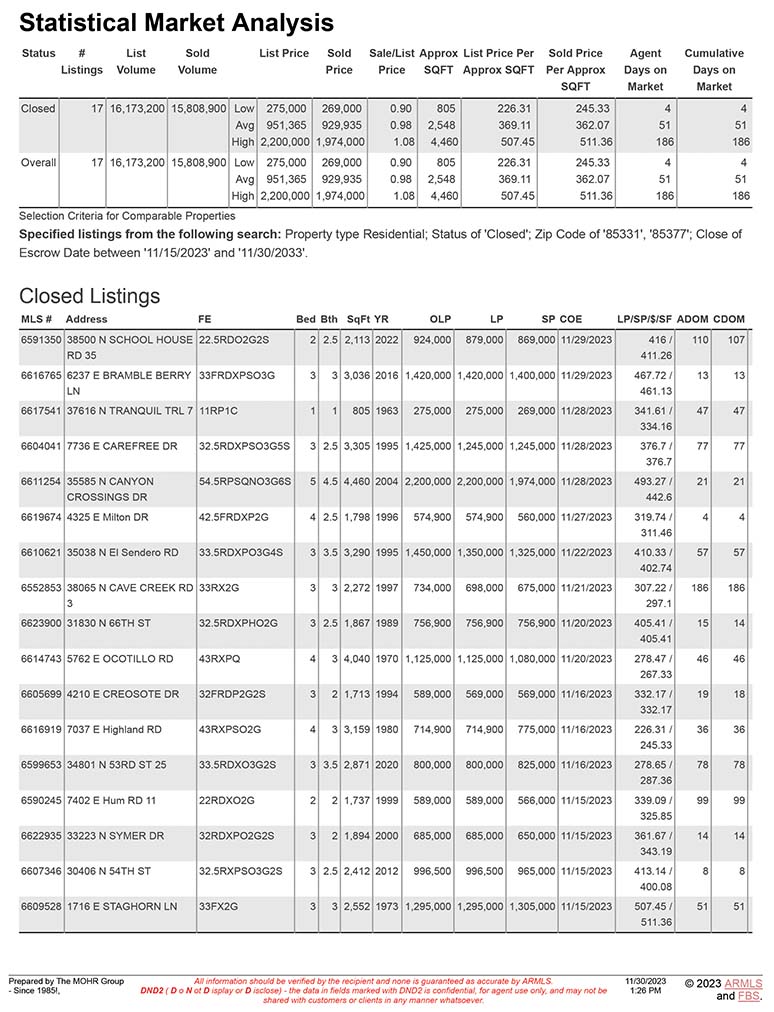
2008 – 21, 557 closed short sale/bank owned properties/pending foreclosure per ARMLS
2023 – 454 closed short sale/bank owned properties/pending foreclosures per ARMLS
