


The data table is compliments of the Cromford Report.
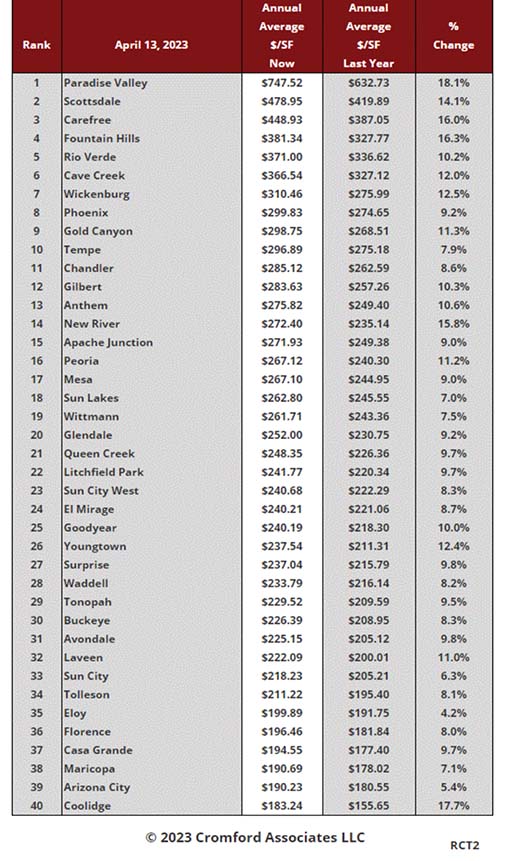
This table ranks the cities by their annual average sales price per square foot. Only single family detached homes are included in these numbers. Information for the large and secondary cities is current as of the date shown. Data for the 11 small cities is updated on a monthly basis, and is measured on the 13th of each month.
The primary function of this table is to show the least and most affordable areas in the Phoenix metropolitan area together with longer term pricing trends.
Annual averages are based on a relatively large number of sales. Therefore they are not as subject to rapid change as monthly averages. The downside is that they do not necessarily represent the current market very accurately, since they include sales from up to a year ago. Pricing may have moved a great deal since then.
Note that Higley has been included in Gilbert and Ahwatukee and Desert Hills are included in Phoenix.
Supply and demand are king. Thinking of selling? Call The Mohr Group, Realty Executives! Ryan, 480-204-2619, Kendal, 303-549-8224, Janet 602-980-7653! We have the information to keep you up to date in the Real Estate Market!

